第一个通用意义分割模型?Segment Anything Model (SAM)在遥感数据上的应用测试
4月6号,facebook发布一种新的语义分割模型,Segment Anything Model (SAM)。仅仅3天时间该项目在Github就收获了1.8万个star,火爆程度可见一斑。有人甚至称之为CV领域的GPT时刻。SAM都做了什么让大家如此感兴趣?
- SAM与传统单纯的语义分割方式不同,加入了Prompt机制,可以将文字、坐标点、坐标框等作为辅助信息优化分割结果,这一方面增加了交互的灵活性,另一方面这也是解决图像分割中尺度问题的一次有益尝试。
- 当在识别要分割的对象时遇到不确定性,SAM 能够生成多个有效掩码。
- SAM 的自动分割模式可以识别图像中存在的所有潜在对象并生成蒙版。
- 贡献了目前全球最大的语义分割数据集。


相信看到这些介绍后很多RSer会和我一样好奇SAM在遥感数据上应用效果如何,我们已经替大家先试了试,总体感觉不错。同时,构建了一个在线体验的APP:https://junchuanyu-segrs.hf.space,在线APP由于是CPU服务器速度相对慢,本地测试请看后面教程,公众号回复“sam”可以获取到测试用的影像和测试结果。
我一直认为智能交互解译是AI在遥感解译方面的短期发展目标,事实上在遥感领域已有不少成熟的产品在向这个方向努力,SAM的提出提供了一个有价值的参考,目前SAM更可能作为一种基础模型在细分领域迭代,相信很快会有基于SAM展开的遥感相关的研究出现,让我们拭目以待。
SAM相关资料:
Dataset:https://ai.facebook.com/datasets/segment-anything-downloads/
Official Demo:https://segment-anything.com/demo
1. 环境配置
环境配置相对简单,安装好torch环境,从SAM官方github中克隆SegmentAnything代码,并下载模型文件,并安装Opencv集ipywidgets等必要的库函数即可。
# 导入必要的库函数
import numpy as np
import torch
import matplotlib.pyplot as plt
import cv2
import os
import ipywidgets as widgets
import sys
import glob
from segment_anything import sam_model_registry, SamPredictor
from segment_anything import sam_model_registry, SamAutomaticMaskGenerator, SamPredictor
2. 交互式分割
SAM提供了两种分割方式,一种是在提示信息辅助下以交互形式进行分割,另一种是全自动分割。前者更有针对性适合小场景,后者更适合大范围应用。
# 定义可视化函数
def show_mask(mask, ax, random_color=False):
    if random_color:
        color = np.concatenate([np.random.random(3), np.array([0.6])], axis=0)
    else:
        color = np.array([30/255, 144/255, 255/255, 0.6])
    h, w = mask.shape[-2:]
    mask_image = mask.reshape(h, w, 1) * color.reshape(1, 1, -1)
    ax.imshow(mask_image)

def show_points(coords, labels, ax, marker_size=375):
    pos_points = coords[labels==1]
    neg_points = coords[labels==0]
    ax.scatter(pos_points[:, 0], pos_points[:, 1], color='green', marker='*', s=marker_size, edgecolor='white', linewidth=1.25)
    ax.scatter(neg_points[:, 0], neg_points[:, 1], color='red', marker='*', s=marker_size, edgecolor='white', linewidth=1.25)
# 显示一个机场的影像
image = cv2.imread('./test/test.jpg')
image = cv2.cvtColor(image, cv2.COLOR_BGR2RGB)
plt.figure(figsize=(10,10))
plt.imshow(image)
2.1 交互式选点
交互式预测需要提示信息,这里的提示信息分为三类,文本、坐标点和坐标框。我们以比较直观的坐标点为例进行演示。首先要构建一个能个交互场景下选点的工具
# 用来实现交互式选点,实时显示点的图像坐标
def onclick(event):

    ax.clear()
    ax.imshow(image)
    ax.scatter(event.xdata, event.ydata, s=100, color='red')
    plt.draw()
    x_slider.value = event.xdata
    y_slider.value = event.ydata
    pointx.append(x_slider.value)
    pointy.append(y_slider.value)
    print(pointx)
# Update the position of the point when slider values are changed
def on_value_change(change):
    ax.clear()
    ax.imshow(image)
    ax.scatter(x_slider.value, y_slider.value, s=100, color='red')
    # plt.draw()

#必须加上这一行,否则无法显示交互式界面
%matplotlib widget
pointx=[]
pointy=[]
fig, ax = plt.subplots(figsize=(8,6))
ax.imshow(image)
plt.axis('off')
# Initialize the slider variables with the coordinates of the center of the picture
x_slider = widgets.FloatSlider(min=0, max=image.shape[1], step=1,description='X:', value=image.shape[1] // 2)
y_slider = widgets.FloatSlider(min=0, max=image.shape[0], step=1,description='Y:', value=image.shape[0] // 2)
x_slider.observe(on_value_change, names='value')
y_slider.observe(on_value_change, names='value')
cid = fig.canvas.mpl_connect('button_press_event', onclick)
<img src="https://dunazo.oss-cn-beijing.aliyuncs.com/blog/20230409_001251.gif" style="margin-right:25px;width:70%;height:70%;">%matplotlib inline
#通过交互工具选点,将坐标点显示在影像上
tmp=list(zip(pointx,pointy))
input_point = np.array(tmp)
input_label = np.zeros(input_point.shape[0])+1 # 1 for positive, 0 for negative
print(input_point)
plt.figure(figsize=(8,8))
plt.imshow(image)
show_points(input_point, input_label, plt.gca())
plt.show() [[161.68633534 72.98191204]
[877.04076261 201.13987133]]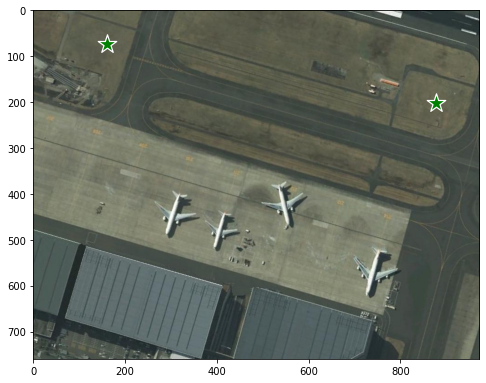
2.2 生成掩膜
加载交互式预测模型,并基于选取的点,对图像进行分割
# load模型文件,定义预测模型为Sampredictor即交互式预测
sam_checkpoint = "sam_vit_h_4b8939.pth"
model_type = "vit_h"
device = "cuda"
sam = sam_model_registry[model_type](checkpoint=sam_checkpoint)
sam.to(device=device)
predictor = SamPredictor(sam)
predictor.set_image(image) # embedding操作
# 预测效率较高v100显卡大概3s完成预测
masks, scores, logits = predictor.predict(
    point_coords=input_point,
    point_labels=input_label,
    multimask_output=True,)
#当multimask_output设置为True时,模型将根据不同的预测概率输出三个mask结果,如果设置为False将直接输出一个自有结果
len(masks)3可以看到三个mask对应尺度是不同,每个结果都具有较好的语义信息
plt.figure(figsize=(20,15))

for i, (mask, score) in enumerate(zip(masks, scores)):
    plt.subplot(1,3,i+1)
    plt.imshow(image)
    show_mask(mask, plt.gca())
    show_points(input_point, input_label, plt.gca())
    plt.title(f"Mask {i+1}, Score: {score:.3f}", fontsize=18)
    plt.axis('off')
plt.show()

2.3 补充辅助信息
我们再增加一些负样本作为辅助信息来强化对目标的分割,这里假设我们想提取图像上部的水泥地部分,因此在图中右下角的水泥地增加负样本
%matplotlib widget
pointx=[]
pointy=[]
fig, ax = plt.subplots(figsize=(8,6))
ax.imshow(image)
plt.axis('off')
# Initialize the slider variables with the coordinates of the center of the picture
x_slider = widgets.FloatSlider(min=0, max=image.shape[1], step=1,description='X:', value=image.shape[1] // 2)
y_slider = widgets.FloatSlider(min=0, max=image.shape[0], step=1,description='Y:', value=image.shape[0] // 2)

x_slider.observe(on_value_change, names='value')
y_slider.observe(on_value_change, names='value')

cid = fig.canvas.mpl_connect('button_press_event', onclick)

%matplotlib inline
# 切记将前面已经选的正样本点和后面选的负样本点合并在一起
tmp1=list(zip(pointx,pointy))
input_point = np.array(tmp+tmp1)
labtmp=list(np.ones(len(tmp)))+list(np.zeros(len(tmp1))) #label 设置为0表示为背景信息,需要被排除掉,设置为1表示增加正样本点
input_label=np.array(labtmp)
mask_input = logits[np.argmax(scores), :, :] # Choose the model's best mask# 通过交互工具选择三个点,作为想要剔除的背景辅助信息
plt.figure(figsize=(10,10))
plt.imshow(image)
show_points(input_point, input_label, plt.gca())
plt.show() 
predictor.set_image(image) # embedding操作

masks, scores, logits = predictor.predict(
    point_coords=input_point,
    point_labels=input_label,
    multimask_output=True,)
# 当multimask_output设置为False时可以按照下面语句输出单个mask结果
# plt.figure(figsize=(10,10))
# plt.imshow(image)
# show_mask(masks, plt.gca())
# show_points(input_point, input_label, plt.gca())
# plt.title(f"Mask {i+1}, Score: {scores[0]:.3f}", fontsize=18)
# plt.show()
# 灵活运用交互选点工具,补充正负样本可以让模型更好的识别出想要的目标
plt.figure(figsize=(20,15))
for i, (mask, score) in enumerate(zip(masks, scores)):
plt.subplot(1,3,i+1)
plt.imshow(image)
show_mask(mask, plt.gca())
show_points(input_point, input_label, plt.gca())
plt.title(f"Mask {i+1}, Score: {score:.3f}", fontsize=18)
plt.axis('off')
plt.show() 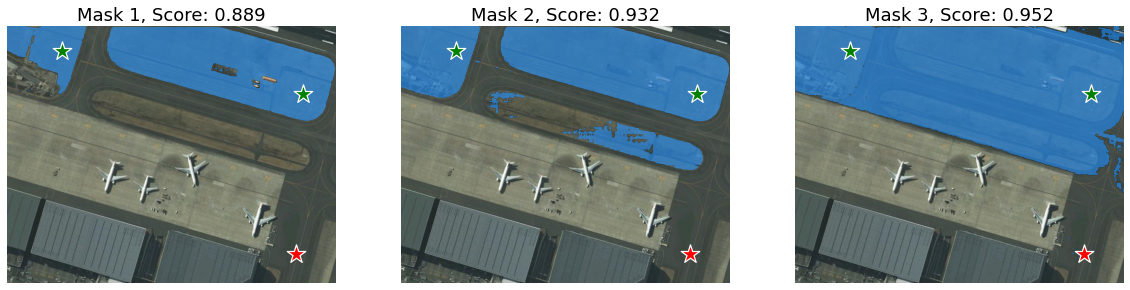
3. 自动式分割
原理是在图像上生成等距离格网,每个点都作为提示信息,SAM可以从每个提示中预测多个掩码。 然后,使用non-maximal suppression对掩膜结果进行过滤和优化
3.1 自动分割
#实例分割的掩膜是由多个多边形组成的,可以通过下面的函数将掩膜显示在图片上
def show_anns(anns):
    if len(anns) == 0:
        return
    sorted_anns = sorted(anns, key=(lambda x: x['area']), reverse=True)
    ax = plt.gca()
    ax.set_autoscale_on(False)
    polygons = []
    color = []
    for ann in sorted_anns:
        m = ann['segmentation']
        img = np.ones((m.shape[0], m.shape[1], 3))
        color_mask = np.random.random((1, 3)).tolist()[0]
        for i in range(3):
            img[:,:,i] = color_mask[i]
        ax.imshow(np.dstack((img, m*0.35)))
#加载模型文件并定义预测模型为SamAutomaticMaskGenerator
# sam_checkpoint = "sam_vit_h_4b8939.pth"
# model_type = "vit_h"
# device = "cuda"
# sam = sam_model_registry[model_type](checkpoint=sam_checkpoint)
# sam.to(device=device)
mask_generator = SamAutomaticMaskGenerator(sam)
masks = mask_generator.generate(image)
#此时masks包含多种信息,segmentation', 'area', 'bbox', 'predicted_iou', 'point_coords', 'stability_score', 'crop_box'分别代表掩膜文件、多边形、坐标框、iou、采样点、得分、裁剪框
print(len(masks)) #多边形个数,数值越大,分割粒度越小
print(masks[0].keys())69
dict_keys(['segmentation', 'area', 'bbox', 'predicted_iou', 'point_coords', 'stability_score', 'crop_box'])plt.figure(figsize=(10,10))
plt.imshow(image)
show_anns(masks) #显示过程较慢
plt.show() 
3.2 自动分割参数优化
遥感数据具有多尺度的特点,全自动分割对于某些尺度较小的目标提取效果并不好,比如下面整个案例
img = cv2.imread('./test/test2.png')
img = cv2.cvtColor(img, cv2.COLOR_BGR2RGB)
lab = cv2.imread('./test/test2_out.png')

plt.figure(figsize=(20,15))
plt.subplot(1,2,1)
plt.imshow(img)
plt.subplot(1,2,2)
plt.imshow(lab)
plt.show()
SamAutomaticMaskGenerator中有几个可调参数,用于控制采样点的密度以及去除低质量或下面积的空洞,通过调节这些参数可以改善提取效果
mask_generator_2 = SamAutomaticMaskGenerator(
    model=sam,
    points_per_side=64, #默认32
    pred_iou_thresh=0.8, #默认0.98
    stability_score_thresh=0.9, #默认0.95
    crop_n_layers=1,
    crop_n_points_downscale_factor=2,
    min_mask_region_area=10,  # Requires open-cv to run post-processing
)
# 参数调节过大会导致运行速度很慢,酌情处理
masks2 = mask_generator_2.generate(image)
len(masks2)2204plt.figure(figsize=(20,15))
plt.subplot(1,2,1)
show_anns(masks2)
plt.subplot(1,2,2)
plt.imshow(lab)
plt.show()
4. 不同遥感影像分割案例
选择一些遥感影像进行测试,基本包含了常见的一些场景
def segment_image(image,out):
    masks = mask_generator.generate(image)
    plt.clf()
    ppi = 100
    height, width, _ = image.shape
    plt.figure(figsize=(width / ppi, height / ppi), dpi=ppi)
    plt.imshow(image)
    show_anns(masks)
    plt.axis('off')
plt.savefig(out, bbox_inches='tight', pad_inches=0)filelist=glob.glob('./images/*')
for file in filelist[9:16]:
root,filename = os.path.split(file)
basename,ext = os.path.splitext(filename)
output_file = os.path.join('./images/',basename+'_out.png')
image = cv2.imread(file)
segment_image(image,output_file)def read_img(url,rgb=True):
img = cv2.imread(url)
if rgb:
img = cv2.cvtColor(img, cv2.COLOR_BGR2RGB)
return np.resize(img,(900,600))result=glob.glob('./result/*')
images = []
for i in range(20):
image = read_img(result[i],rgb=False)
images.append(image)
# Create plot with 4 rows and 5 columns
fig, axs = plt.subplots(nrows=4, ncols=5, figsize=(30,15))
fig.tight_layout(pad=0.2)
# Iterate through images and plot each one
for i, ax in enumerate(axs.flat):
ax.imshow(images[i], cmap='gray')
ax.axis('off')
plt.show()
5. 总结
facebook发布SAM模型的同时也发布了全球迄今为止最大的语义分割数据集,其中大量标签数据正是通过SAM的交互式分割而迭代形成的。训练数据中以自然图像为主,并不包含遥感数据,但从实验结果看该确实对遥感数据也有一定效果,这也许是“大力出奇迹”的又一次胜利。但仔细看分割结果还存在不少问题,虽然优化模型参数能取得更好的效果但很大程度影响计算效率。SAM从表面上看与超像素分割+CNN的模式有些类似,但识别边界和场景理解更准确,然而对于小尺度的目标,尤其是线状地物依然难以实现精确分割。SAM的根本性创新在于prompt的加入,相信后续可以迭代出更多的玩法。目前,SAM的更适用于作为基础模型提供一种辅助信息,与现有的分割算法相结合相互补充。
请关注微信公众号【45度科研人】获取更多精彩内容,欢迎后台留言!