使用Gradio构建交互式Web应用
这是一个关于如何使用 Gradio 构建 Web 应用程序的开源系列教程。你将从设置 Python 环境开始,学习文本、图像等各类输入组件,自定义界面,设计复杂的交互等。本课程还将涵盖使用 Gradio 和 GDAL 处理遥感数据,用于图像增强、地理坐标转换、坡度分析等任务;学习如何使用 Gradio 和 Foliumap 创建交互式地图,实现动态地理空间数据可视化;如何集成机器学习模型并在 Hugging Face Spaces 上发布 web 应用程序。本教程包括实例、演示和作业。完成本教程后,你将能够高效地构建、部署和共享交互式 Web 应用程序。
课程相关资源链接GITHUB

## Part3 :Gradio与遥感数据处理(上)
DEMO 3-1: 多通道遥感数据的可视化
在利用Gradio进行遥感数据处理时,我们需要关注遥感数据的读取,可视化以及渲染方式。本案例中以“classification.tif”为例,该影像前三个波段为RGB信息,第四个通道为分类结果信息。
读取 gr.Image是我们呈现遥感图像的唯一接口,它默认接受三种形式数据,PIL对象,字符串形式的图像路径以及numpy数组,前两者均只支持png,jpg等格式的自然图像,tiff,img,dat,hdf5等多通道的遥感影像均不支持,因此我们需要构建一个遥感影像读取的函数将遥感影像转换为numpy数组。
可视化 用于可视化的numpy数组需要符合matplotlib.pyplot的渲染要求,即0-255整形数组或0-1的浮点型数组。此外,当呈现单通道影像如分类结果的时候,还需要设置色带。
输入 由于无法直接用gr.Image接收遥感影像,因此输入通常是文件路径,我们可以通过上传或给出绝对路径字符串来实现输入,需要注意的是上传是将本地文件进行拷贝,作为临时文件进行处理。
遥感参数 投影信息等可以通过文本形式进行传递,需要注意数据格式的对齐,比如function中输出为str,接收的gradio组件也应支持str,本案例中是将遥感参数信息作为字符串进行展示。
logging 为了监控程序的处理过程,我们用logging对处理过程进行后台播报以及记录。
from osgeo import gdal, osr
import gradio as gr
import numpy as np
import matplotlib.pyplot as plt
import logging

# 使用日志记录应用的状态
logging.basicConfig(filename='app.log', level=logging.INFO, format='%(asctime)s:%(levelname)s:%(message)s')

# 定义图像的线性拉伸函数,用于增强对比度
def stretch_n(band, lower_percent=5, higher_percent=95):
    band=np.array(band,dtype=np.float32)
    c = np.percentile(band, lower_percent)*1.0
    d = np.percentile(band, higher_percent)*1.0
    band[band<c] = c
    band[band>d] = d
    out =  (band - c)  / (d - c)
    return out.astype(np.float32)

# 对每个波段进行对比度调整
def adjust_contrast(data,n_band=3):
    data=np.array(data,dtype=np.float32)
    for img in data:
        for k in range(n_band):
            img[:,:,k] = stretch_n(img[:,:,k])
    return data

def Load_image_by_Gdal(file_path):
    img_file = gdal.Open(file_path, gdal.GA_ReadOnly)
    img_bands = img_file.RasterCount # 波段数量
    img_height = img_file.RasterYSize # 高度
    img_width = img_file.RasterXSize # 宽度
    img_arr = img_file.ReadAsArray() # 获取图像数组
    geomatrix = img_file.GetGeoTransform() # 获取地理变换矩阵
    projection = img_file.GetProjectionRef() # 获取投影信息
    return img_bands,img_arr, geomatrix, projection

# 定义读取tiff文件的函数
def read_tiff(file):
    img_bands,img_arr, geomatrix, projection =Load_image_by_Gdal(file)
    if img_bands >1 :
        img_arr=img_arr.transpose(( 1, 2,0))
    return img_arr, geomatrix, projection

# 定义重置状态的函数
def reset_state():
    return None,None,None,[]

# 定义文件上传后的图像处理和可视化函数
def upload_file(files):
    print(files,files.name) # 如果你不确定gradio组件的输出格式是否正确,可以通过打印来进行确认,此处files为临时文件,起绝对路径为files.name。
    logging.info(f"File uploaded: {files.name}")
    file_patchs=files.name
    img_arr, geomatrix, projection=read_tiff(file_patchs)
    rgb=img_arr.copy()[:,:,:3]
    mask=img_arr.copy()[:,:,-1]
    img=adjust_contrast(np.expand_dims(rgb,axis=0))
    palette = np.array([ [83,49,125],   [56,173,20],   [210,10,115], [19,188,106], [16,96,160]]) # 自定义色带
    predc=palette[mask]

    dict_info={"image shape":img_arr.shape,"max value":np.max(img_arr)}
    if isinstance(projection, str):
        spatial_ref = osr.SpatialReference()
        spatial_ref.ImportFromWkt(projection)
        utm_zone = spatial_ref.GetUTMZone()
        if utm_zone:
            dict_info["UTM zone"] = utm_zone
            dict_info["Projection"] = f"WGS 84 / UTM Zone {utm_zone}"

    # 将字典信息转换为字符串,每个键值对占一行
    info_lines = "\n".join([f"{key}: {value}" for key, value in dict_info.items()])

    logging.info(f"File info: {info_lines}")
    return img[0],predc,info_lines # 返回归一化后的RGB数组,掩膜图像数组和影像信息

# 使用gradio的Blocks创建用户界面
with gr.Blocks(theme="gradio/sketch") as demo: # 使用草图主题

    gr.Markdown('''# <center>Remote Sensing Imagery Visulization</center>''')  # 标题,使用markdown语法
    upload_button = gr.UploadButton("Click to Upload a Tiff", file_types=["tiff"], file_count="single") # 定义上传按钮
    with gr.Row():
        showimg=gr.Image(label="RGB") # 输出RGB图像数组
        img_output = gr.Image(label="label") # 输出掩膜图像数组
    outtext=gr.Textbox(label="img_info") # 输出图像信息
    emptyBtn = gr.Button("Restart",variant="secondary")

    # 为上传按钮设置上传文件后的处理函数
    upload_button.upload(upload_file, upload_button, [showimg,img_output,outtext])

    # 为重启按钮设置点击后的动作
    emptyBtn.click(reset_state,outputs=[upload_button,showimg,img_output,outtext],show_progress=True)

demo.launch()
DEMO 3-2: DEM可视化与坡度计算
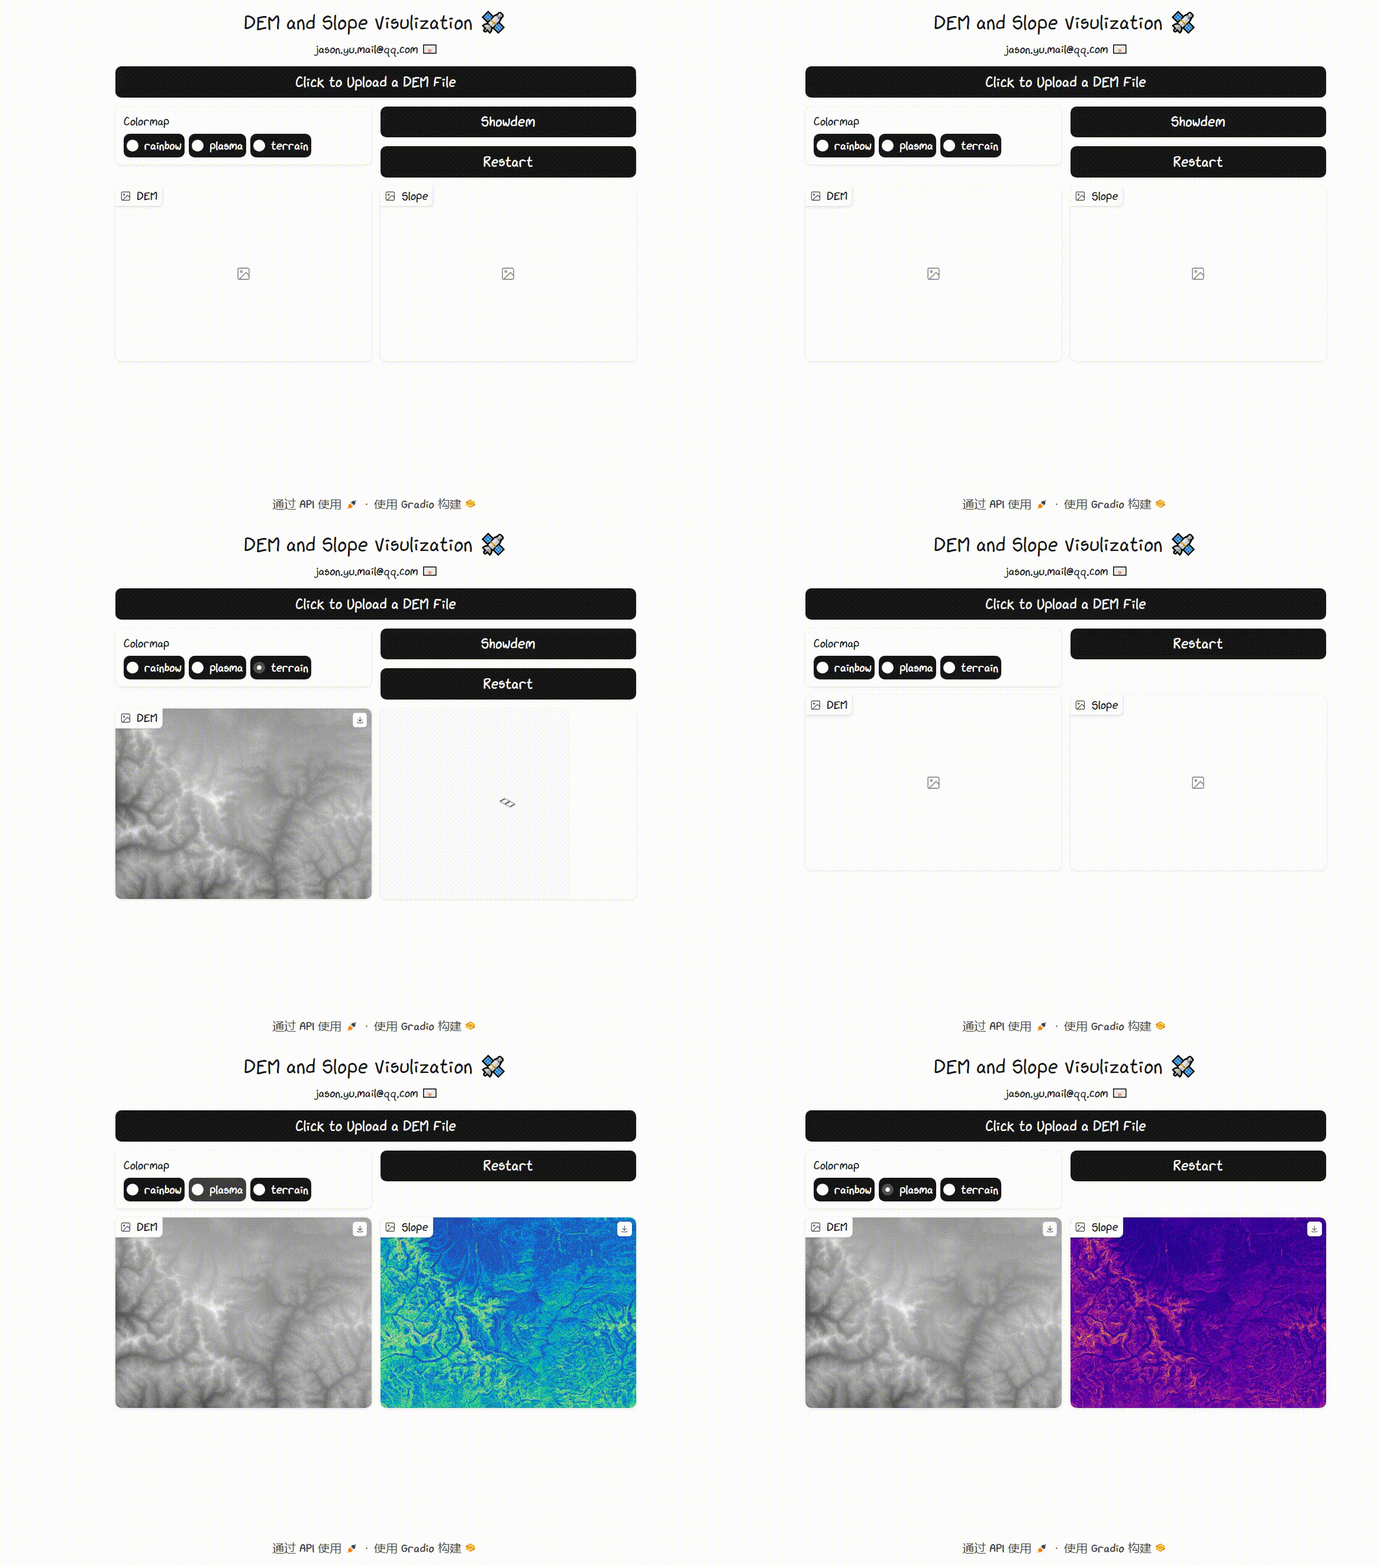
在实际应用中,我们需要了解可视化需求与遥感数据计算需求的差异,同时为了实现更为流畅的应用体验,需要掌握简化交互的一些操作技巧。本案例中以“DEM.tif”地形数据为例进行说明。
数值计算 由于gr.Image只能用于显示单通道灰度或真彩色图像,因此在需要进行遥感数值计算的情况下,通常需要准备两个numpy数组对对象进行保存,一个进行归一化用于显示,一个记录原始numpy数据用于后续分析计算。
临时变量 当我们有一个对象无法用现有的Gradio模块来定义或接收,例如多维数组,我们需要用gr.State来单独定义临时变量来承接这个对象,本案例中定义了一个初始值为NONE的变量demarray来承接show_dem函数输出的dem数组。
使用按钮? 按钮是Gradio应用中必不可少的组件,我们在一些关键交互场景中都需要使用按钮,比如选择数据,运行程序,重置变量等等。但按钮设置过多,且没有合理的引导会导致交互体验变差。很多时候我们可以通过Gradio组件带有的事件激活器来实现动态交互。本例中我们提供了两套具有相同功能的代码,一套是采用按钮,一套是使用事件激活器。
说明文本 我们可以通过文本来设置应用程序的标题,对关键变量做解释,设置是在应用下方给出完整的技术报告。相对于gr.Markdown使用gr.HTML可以实现更为丰富多元的文本内容。
from osgeo import gdal, osr
import gradio as gr
import numpy as np
import matplotlib.pyplot as plt

# Load_image_by_Gdal,read_tiff 函数同前,此处省略
# 计算并可视化DEM的坡度
def showslope(dem_array, colormap='terrain'):
    x_gradient = np.gradient(dem_array, axis=1)
    y_gradient = np.gradient(dem_array, axis=0)
    slope = np.sqrt(x_gradient**2 + y_gradient**2)
    print(dem_array.shape, np.max(slope), np.min(slope))
    slope = np.clip(slope, 0, 90) / 90
    cmap = plt.get_cmap(colormap)
    colormapped_slope = cmap(slope)
    slope_array = colormapped_slope[:, :, :3]
    return dem_array/np.max(dem_array),slope_array

# 定义重置状态的函数
def reset_state():
    return None, None, None

# 定义DEM可视化函数
def show_dem(files):
    file_patchs = files.name
    img_arr, _, _ = read_tiff(file_patchs)
    dem_array = img_arr.copy()
    return dem_array

with gr.Blocks(theme="Gstaff/Xkcd") as demo:  # 本案例采用黑白风格主题,其他主题:["Default", "Glass", "Monochrome", "Gstaff/Xkcd", "NoCrypt/Miku", "gradio/soft"]
    demarray = gr.State(None)  # 定义临时变量
    # 添加HTML头部
    gr.HTML("""
                <center>
                <h1> DEM and Slope Visulization  🛰️ </h1>
                <b> jason.yu.mail@qq.com  📧<b>
                </center>
                """)
    upload_button = gr.UploadButton("Click to Upload a DEM File", file_types=["image"], file_count="single")
    with gr.Row():
        with gr.Column(scale=50):
            choice = gr.Radio(choices=["rainbow", "plasma", "terrain"], label="Colormap")
        with gr.Column(scale=50):
            showdem = gr.Button("Showdem", variant="primary")
            emptyBtn = gr.Button("Restart", variant="secondary")  # 为按钮设置不同级别的主题,variant="primary" 为主色调,secondary为副色调
    with gr.Row():
        showimg = gr.Image(label="DEM")
        img_output = gr.Image(label="坡度")

    # 使用临时变量demarray接收show_dem函数输出的dem数组
    upload_button.upload(show_dem, upload_button, [demarray])
    # 定义按钮点击事件以同时显示dem影像及坡度图像
    showdem.click(showslope, [demarray, choice], [showimg,img_output])

    emptyBtn.click(reset_state, outputs=[upload_button, showimg, img_output], show_progress=True)

demo.launch()
上面例子的缺点是需要选择渲染风格再点击按钮才能够展示图像,对于目的明确的应用可以设计的更为简洁,减少交互次数。因此可以做两个方面的修改,一是,数据上传之后即显示,取消点击后再显示;二是,实现在选择渲染风格的同时即实时显示效果。代码修改的内容如下:
# Load_image_by_Gdal,read_tiff,reset_state 函数同前,此处省略
# 计算并可视化DEM的坡度
def calculate_slope(files, colormap='terrain'):
    print(files.name, colormap)
    file_patchs = files.name
    img_arr, _, _ = read_tiff(file_patchs)
    dem_array = img_arr.copy()
    print(dem_array.shape, np.max(dem_array))
    # 计算x和y方向的梯度
    x_gradient = np.gradient(dem_array, axis=1)
    y_gradient = np.gradient(dem_array, axis=0)
    # 计算坡度
    slope = np.sqrt(x_gradient**2 + y_gradient**2)
    print(dem_array.shape, np.max(slope), np.min(slope))
    slope = np.clip(slope, 0, 90) / 90
    cmap = plt.get_cmap(colormap)
    colormapped_slope = cmap(slope)
    slope_array = colormapped_slope[:, :, :3]  # 提取RGB波段
    return dem_array / np.max(dem_array), slope_array #返回一个归一化的dem数组,一个slope数组

with gr.Blocks(theme="Gstaff/Xkcd") as demo:
    demarray = gr.State(None)
    gr.HTML("""
                <center>
                <h1> DEM and Slope Visulization  🛰️ </h1>
                <b> jason.yu.mail@qq.com  📧<b>
                </center>
                """)
    upload_button = gr.UploadButton("Click to Upload a DEM File", file_types=["image"], file_count="single")
    with gr.Row():
        with gr.Column(scale=50):
            choice = gr.Radio(choices=["rainbow", "plasma", "terrain"], label="Colormap")
        with gr.Column(scale=50):
            showdem = gr.Button("Showdem", variant="primary")
            emptyBtn = gr.Button("Restart", variant="secondary")
    with gr.Row():
        showimg = gr.Image(label="DEM")
        img_output = gr.Image(label="坡度")

    # 对按钮设置事件监听器,当有文件上传的时候,便激活calculate_slope函数来显示dem数据
    upload_button.upload(calculate_slope, [upload_button], [showimg,img_output])
    # 设置类似的事件触发器在choice按钮上,需要注意的是calculate_slope函数可以接收两个输入值,其中colormap是具备默认值的,此处由choice选项的数值对其进行更新
    choice.change(calculate_slope, [upload_button,choice], [showimg,img_output])

    emptyBtn.click(reset_state, outputs=[upload_button, showimg, img_output], show_progress=True)

demo.launch()
| 请关注微信公众号【45度科研人】回复“@gradio”获取该教程配套数据,欢迎后台留言! |
 |
为了促进沟通与交流,我们建立了「养生科研」学术交流群。这个平台不仅能够让大家迅速获取本公众号的资源,还为各位提供了一个共同探讨问题、交流思想的空间。有意向加入交流群的朋友们,可以通过添加小编的微信来获得入群邀请。请注意,在添加时请按照“加群-单位-研究方向-姓名”的格式备注您的信息,否则您的申请可能无法通过。
